

Bitcoin Holds Above 90K, Can ETH Make a Run for 2K?
BTC/USD
+1.32%
Add to/Remove from Watchlist
Add to Watchlist
Add Position
Position added successfully to:
Please name your holdings portfolio
Type:
BUY
SELL
Date:
Amount:
Price
Point Value:
Leverage:
1:1
1:10
1:25
1:50
1:100
1:200
1:400
1:500
1:1000
Commission:
Create New Watchlist
Create
Create a new holdings portfolio
Add
Create
+ Add another position
Close
ETH/USD
+8.06%
Add to/Remove from Watchlist
Add to Watchlist
Add Position
Position added successfully to:
Please name your holdings portfolio
Type:
BUY
SELL
Date:
Amount:
Price
Point Value:
Leverage:
1:1
1:10
1:25
1:50
1:100
1:200
1:400
1:500
1:1000
Commission:
Create New Watchlist
Create
Create a new holdings portfolio
Add
Create
+ Add another position
Close
ETH/BTC
+7.18%
Add to/Remove from Watchlist
Add to Watchlist
Add Position
Position added successfully to:
Please name your holdings portfolio
Type:
BUY
SELL
Date:
Amount:
Price
Point Value:
Leverage:
1:1
1:10
1:25
1:50
1:100
1:200
1:400
1:500
1:1000
Commission:
Create New Watchlist
Create
Create a new holdings portfolio
Add
Create
+ Add another position
Close
- ETH rises 8% in the strongest weekly rise since November
- Ether active addresses jump 10%
- ETH ETFs see inflows on Tuesday for the first time since April 4
- ETH/BTC has recovered 10% from its record low. Could RSI divergence hint at a reversal?
- ETH/USD tests 50 SMA resistance, a critical obstacle ahead of 2k
Bitcoin surged from above 90k to a peak of 94k yesterday before easing back modestly today to 92.5k on profit taking. The price has jumped over 8% so far this week, marking its strongest weekly gain since January 12, the week ahead of Trump’s inauguration.
Bitcoin is not alone; Ethereum is also up over 8% so far this week, marking its strongest weekly gain since the US elections in late November last year.
Ethereum’s performance in 2025 has been disappointing, falling over 55% from its December 2024 peak of 4050 to the 2025 low of 1400 reached on April 9. However, following a 20% recovery from the 1400 low and this week’s 8% rally, could this be the start of a more meaningful recovery for ETH?
Ether Active Address Spike
The number of Ether active addresses has jumped almost 10% to 336,000, up from 306,000 at the start of the week. A sudden increase in the number of active addresses is clear evidence of growing on-chain activities. The increase in network participation at a time when ETH is starting to regain some momentum is an encouraging sign and could be an indication of shifting sentiment.
ETH ETF Inflows Return (Briefly)
Meanwhile, ETH institutional demand flipped bullish this week, sparking $38.8 million net inflows into ETH ETFs on Tuesday. These marked the first net inflows since April 4 and the largest since February 4.
Inflows come at a crucial time when ETH dominance declined below 7%, and after ETH ETFs have seen nearly $1 billion in cumulative outflows since February 20.
ETH ETF inflows would need to persist to help boost ETH price higher.
These latest developments come ahead of the Pectra upgrade on May 7, which is set to introduce several features to the mainnet, boosting staking, scalability, wallet recovery options, and dev tools. This will be its most significant upgrade since launch.
ETH vs BTC
ETH has underperformed BTC since June 2017, dropping almost 90%. However, this could be bottoming out. On the daily chart, bullish RSI divergence could hint towards a rebound, with the RSI forming a higher high versus the price chart’s lower low. ETH/BTC shows a 10% recovery from its record low but would need to rise above the 50 SMA at 0.021 for a more sustained recovery.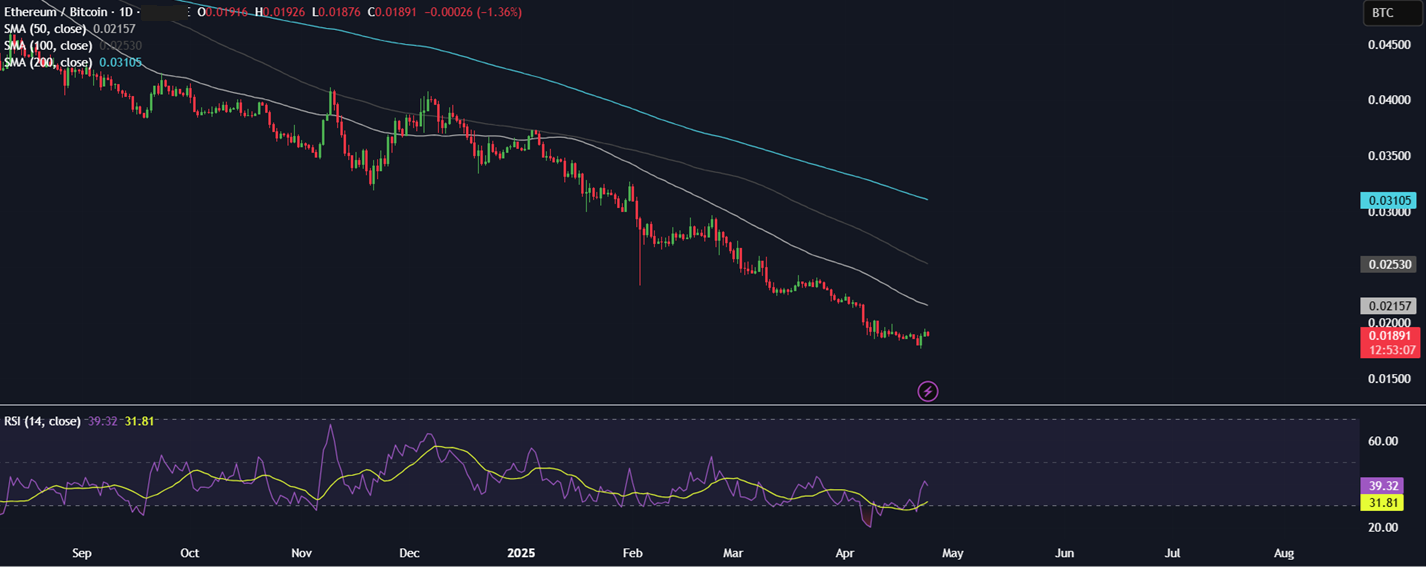 ETH/BTC-Daily Chart
ETH Tests Key Resistance
ETH/USD trades within a multi-month descending channel. The price has recovered from the 1400 low, surging above the midpoint of the falling channel, and is testing the 50 SMA around 1820. A rise above here opens the door to 1900, the upper band of the falling channel, and beyond here, 2000 comes into focus.
Rejection at the 50 SMA could spark a correction lower. The price must hold above 1680 to maintain its bullish bias. A move below 1540 will see sellers take control.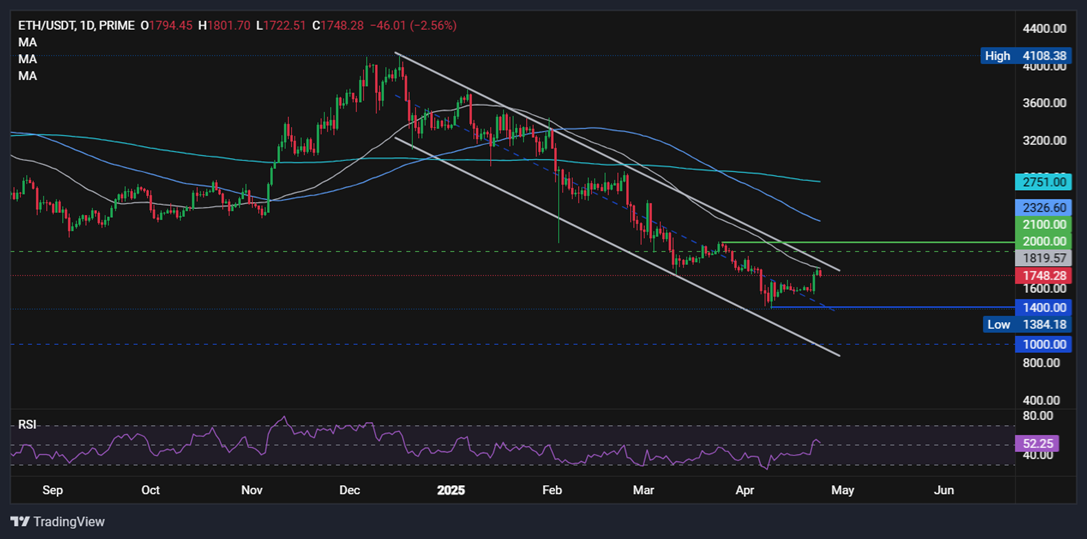 ETH/USD-Daily Chart
Disclaimer: